An analysis of 4,957 providers shows what treatments, conditions, and populations get content attention, and what doesn’t.
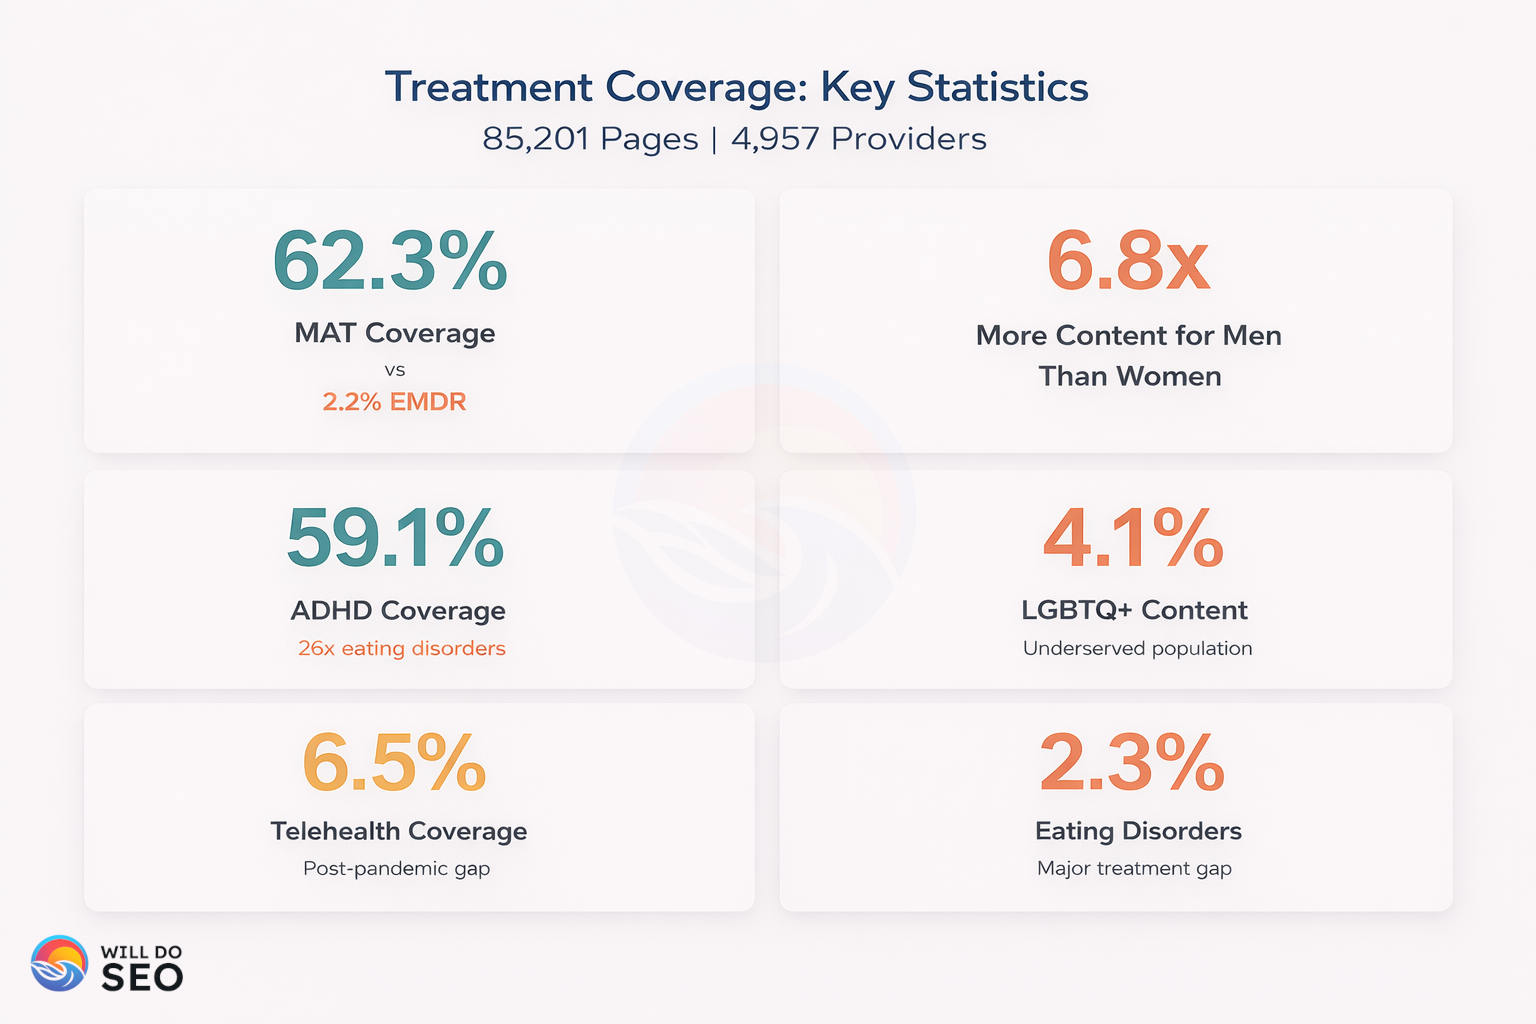
Men get nearly 7x more content than women. 59% of pages mention ADHD, but only 2.3% mention eating disorders. Despite post-pandemic growth, only 6.5% of content addresses telehealth.
I analyzed 85,201 pages across 4,957 behavioral health provider websites to see what providers actually create content about. Not what they offer, not what patients need, but what they write about.
The findings show consistent gaps across treatments, conditions, and populations, and where providers might differentiate.
What I Measured
Categories Analyzed (39 Total)
- Treatment Modalities (10): CBT, DBT, EMDR, MAT, 12-Step Programs, Group Therapy, Family Therapy, Holistic/Alternative, Experiential, Psychodynamic
- Conditions (10): Addiction, Anxiety, Depression, PTSD/Trauma, Bipolar, OCD, ADHD, Eating Disorders, Personality Disorders, Dual Diagnosis
- Populations (10): Children, Adolescents, Young Adults, Adults, Seniors, Veterans, First Responders, LGBTQ+, Women, Men
- Levels of Care (9): Inpatient, Residential, PHP, IOP, Outpatient, Detox, Sober Living, Crisis Services, Telehealth
Algorithm
Pattern Matching Process:
- Defined search terms for each category (e.g., “DBT”, “dialectical behavior therapy”)
- Searched page titles, headings, meta descriptions, and body content
- Page “covers” topic if: pattern in title/heading OR 2+ subheadings OR 3+ body mentions
- Excluded: single mentions, footers, navigation
Weighting:
- Title/H1 matches: High confidence
- Multiple H2 matches: Medium confidence
- Body content (3+ mentions): Medium confidence
Two-Level Analysis
Page-Level Statistics
- What percentage of all 85,201 pages mention each topic?
- Answers: What content gets created?
- Example: “EMDR appears on 2.2% of pages (1,884 pages)”
Domain-Level Statistics
- How many of 4,957 providers create content on each topic?
- Answers: How widespread is coverage across the industry?
- Example: “789 providers (15.9%) have EMDR content”
By the Numbers
- 85,201 web pages from 4,957 behavioral health providers
- Source: SAMHSA FindTreatment.gov database
- Collected: December 2024 – January 2025
- Method: Firecrawl API web scraping
Statistical Significance
- 85,201 sample size: ±0.3% margin of error
- Can detect differences ≥1% with high confidence
Treatment Modalities
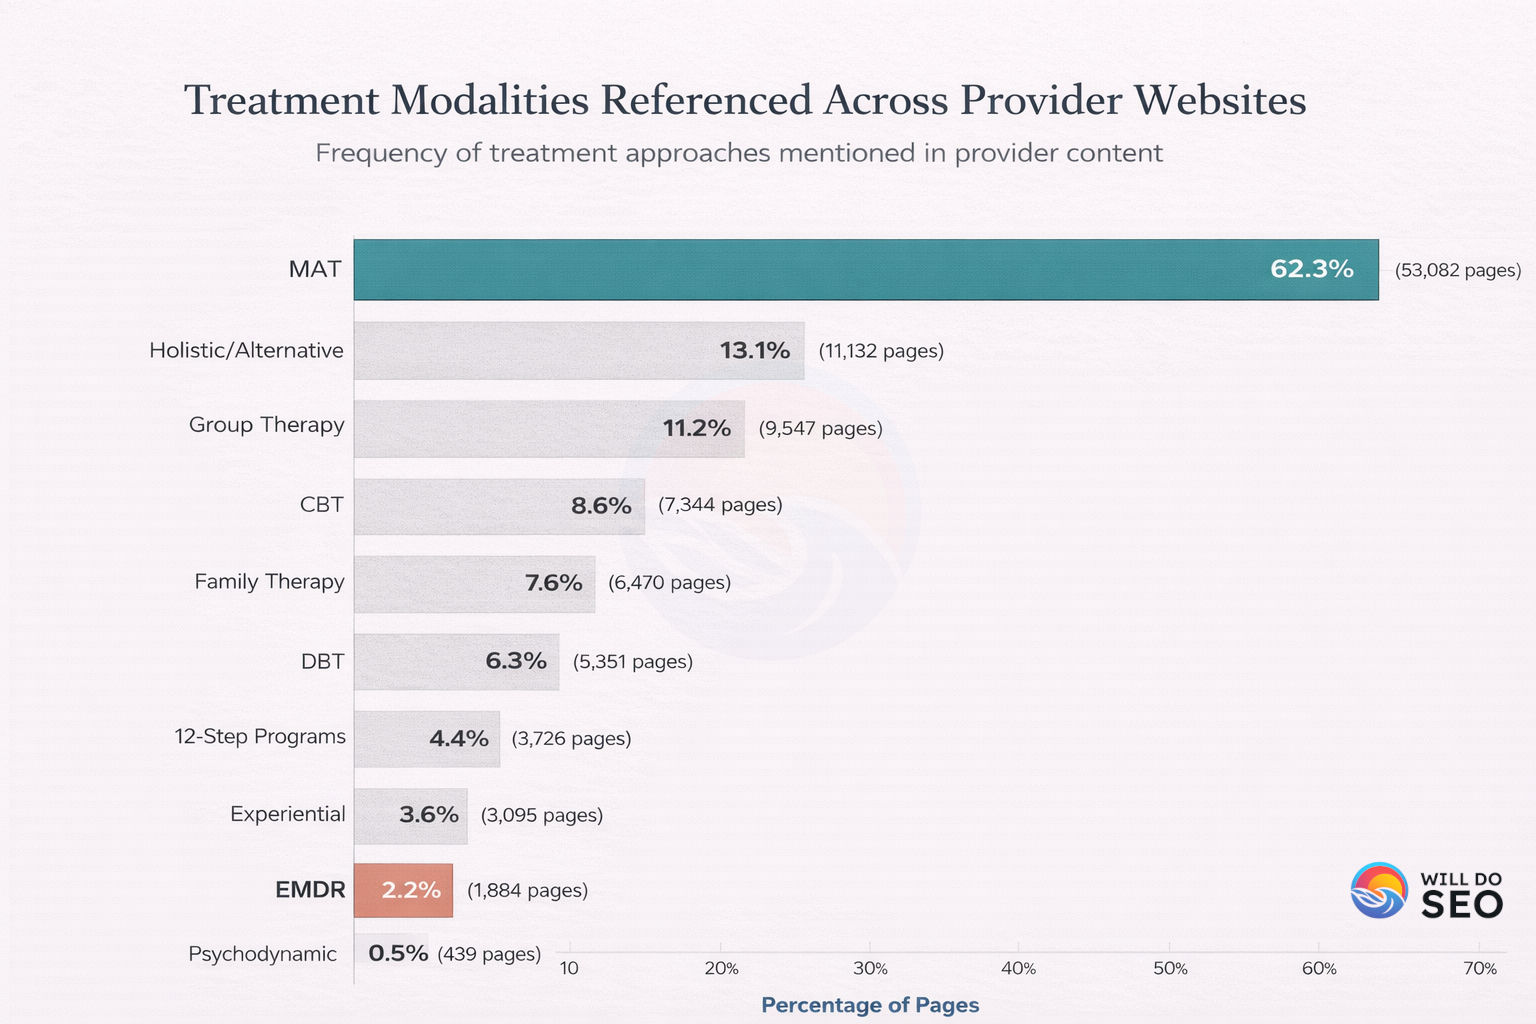
MAT dominates at 62%. Evidence-based psychotherapies like EMDR (2.2%) and DBT (6.3%) are far behind.
The Complete Treatment Coverage Picture
| Treatment | % of Pages | Total Pages | % of Providers Covering |
|---|---|---|---|
| MAT | 62.3% | 53,082 | 89.3% |
| Holistic/Alternative | 13.1% | 11,132 | 58.8% |
| Group Therapy | 11.2% | 9,547 | 53.5% |
| CBT | 8.6% | 7,344 | 51.1% |
| Family Therapy | 7.6% | 6,470 | 49.2% |
| DBT | 6.3% | 5,351 | 38.2% |
| 12-Step Programs | 4.4% | 3,726 | 29.4% |
| Experiential | 3.6% | 3,095 | 26.0% |
| EMDR | 2.2% | 1,884 | 18.0% |
| Psychodynamic | 0.5% | 439 | 5.8% |
MAT: 62% of All Pages
62.3% of all pages mention medication-assisted treatment. This reflects both the strong evidence base (MAT reduces overdose deaths by 50% or more) and the addiction treatment market’s dominance in behavioral health content overall.
Nearly 9 out of 10 providers (89.3%) create MAT content, making it by far the most saturated treatment category in the industry.
12-Step Programs: 4.4%
Only 4.4% of pages mention 12-step programs. Given their historical prominence in addiction treatment, this is lower than expected. It suggests a shift toward clinical and medical models, at least in how providers market themselves online.
Evidence-Based Psychotherapies Are Underrepresented
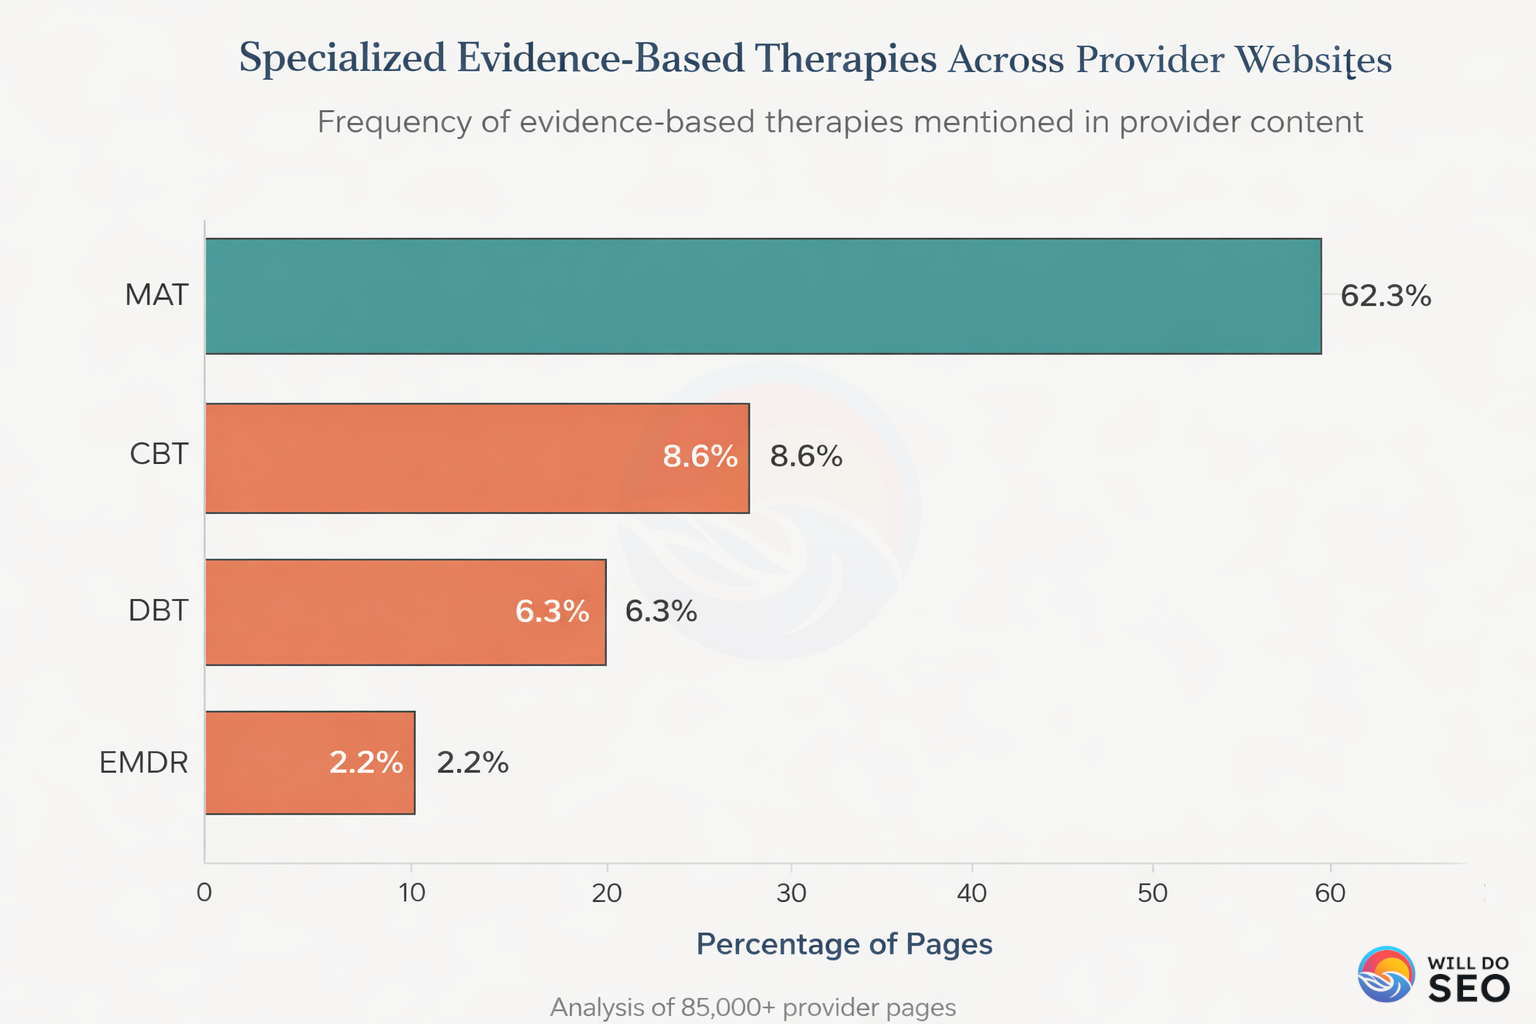
MAT is evidence-based and its dominance makes sense. But other evidence-based treatments, specifically psychotherapies, are underrepresented by comparison.
Despite being the most-researched psychotherapy in history, CBT appears on only 8.6% of pages. DBT, the gold standard for borderline personality disorder, shows up on just 6.3%. And EMDR, recommended by the WHO for PTSD treatment, appears on a mere 2.2% of pages.
These aren’t fringe treatments. They’re well-established psychotherapies with decades of research. Yet they get a fraction of the content attention that MAT receives.
EMDR: 2.2%
EMDR (Eye Movement Desensitization and Reprocessing) illustrates the gap between clinical evidence and content coverage.
The Evidence: The World Health Organization recommends EMDR for PTSD. The American Psychological Association conditionally recommends it for PTSD treatment. Meta-analyses consistently show comparable efficacy to CBT for trauma.
The Coverage: Only 2.2% of pages mention EMDR. Only 18% of providers create any EMDR content. Providers who do cover it average just 2.1 pages on the topic.
The Opportunity: If you specialize in trauma treatment, 82% of providers aren’t creating EMDR content. “EMDR therapy near me” generates 14,800 monthly searches with relatively low competition compared to generic therapy searches.
Specialized psychotherapies with strong evidence bases are underrepresented in content, creating both SEO opportunities and a chance to differentiate your practice.
Actionable Takeaways for Treatment Content
If you offer DBT or EMDR: You’re in the 18-38% of providers creating this content. That’s competitive advantage through specialization.
If you offer holistic/alternative approaches: You’re in a more crowded space (59% of providers), but it resonates with specific patient preferences and search behaviors.
The pattern: Content gap equals ranking opportunity. Low coverage topics mean less competition for “[treatment] + [location]” searches.
Conditions
ADHD appears on 59% of pages. Eating disorders appear on 2.3%.
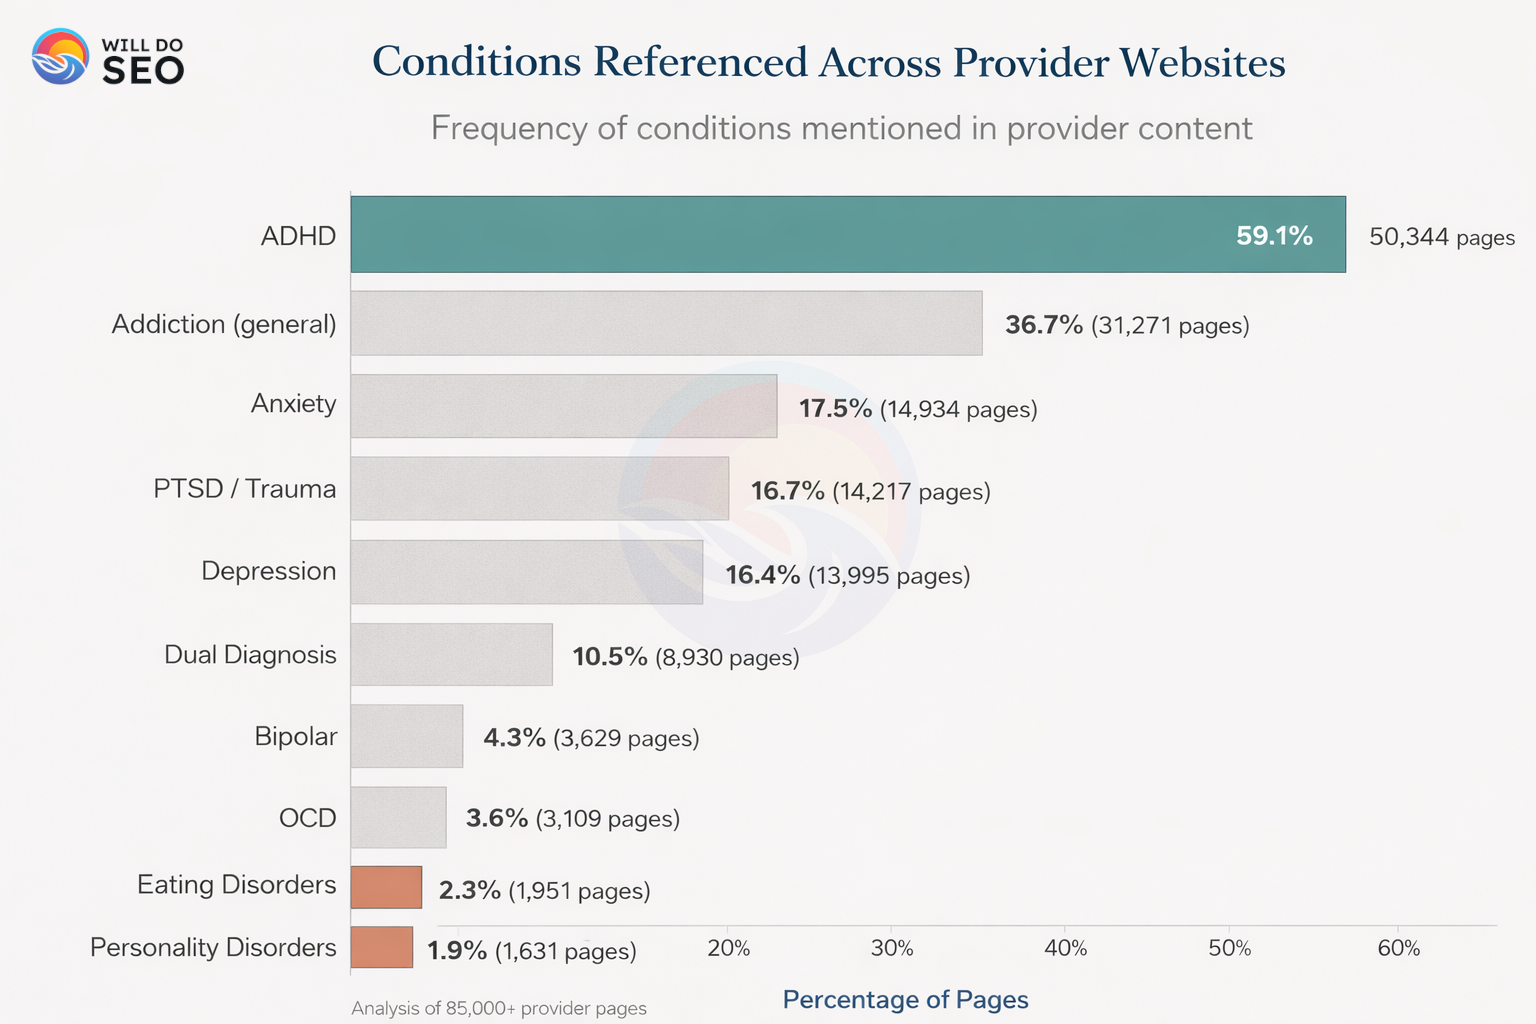
The Complete Condition Coverage Picture
| Condition | % of Pages | Total Pages | % of Providers Covering |
|---|---|---|---|
| ADHD | 59.1% | 50,344 | 91.4% |
| Addiction (general) | 36.7% | 31,271 | 86.3% |
| Anxiety | 17.5% | 14,934 | 78.5% |
| PTSD/Trauma | 16.7% | 14,217 | 73.7% |
| Depression | 16.4% | 13,995 | 77.1% |
| Dual Diagnosis | 10.5% | 8,930 | 60.3% |
| Bipolar | 4.3% | 3,629 | 36.8% |
| OCD | 3.6% | 3,109 | 33.4% |
| Eating Disorders | 2.3% | 1,945 | 19.9% |
| Personality Disorders | 1.9% | 1,631 | 15.0% |
Why ADHD Leads at 59%
ADHD appears on 59.1% of pages, nearly twice the coverage of general addiction content. 91% of providers create ADHD content, making it the most universally covered condition in behavioral health.
Why the dominance? Adult ADHD diagnosis has increased 123% since 2010. Over 50% of people with substance use disorders have ADHD. The combination of medication and therapy creates multiple content opportunities. And search behavior is strong: “ADHD treatment” and “adult ADHD” generate high volume.
This isn’t just about ADHD treatment facilities. It’s about how the entire industry frames dual diagnosis and comorbidity. ADHD appears in general addiction content, dual diagnosis content, and medication management content across the board.
Eating Disorders: 2.3%
28.8 million Americans will have an eating disorder in their lifetime. Eating disorders have the highest mortality rate of any mental illness. Specialized eating disorder treatment is a distinct market with dedicated facilities and insurance categories.
Yet only 2.3% of pages discuss eating disorders. Only 20% of providers create any eating disorder content. That’s 26x less coverage than ADHD.
Why the gap? Market concentration plays a role. Specialized ED facilities operate somewhat separately from general behavioral health. ED searches often don’t overlap with addiction and mental health searches. Insurance authorization processes differ. And ED treatment tends to be marketed in its own silo.
For eating disorder specialists, less content competition means your content works harder. For general providers with ED programs, this is a differentiation opportunity. For content strategists, “eating disorder treatment” plus location remains underserved.
Personality Disorders: 1.9%
9.1% of U.S. adults have a personality disorder. 73% of people with borderline personality disorder have co-occurring substance use disorder. DBT was specifically developed for borderline personality disorder.
Yet only 1.9% of pages mention personality disorders. Only 15% of providers create any content about them.
Stigma plays a role. Personality disorders carry more stigma than other conditions. Treatment complexity matters. These conditions require specialized training in DBT or schema therapy. Many providers worry about marketing to what they perceive as “difficult” patients. And patients may not know they have a personality disorder when searching for help.
The strategic question: Do you serve this population without marketing to them? If so, you’re missing the SEO opportunity for “[personality disorder] treatment” searches, differentiation from providers who don’t specialize, and patients actively searching for this specific care.
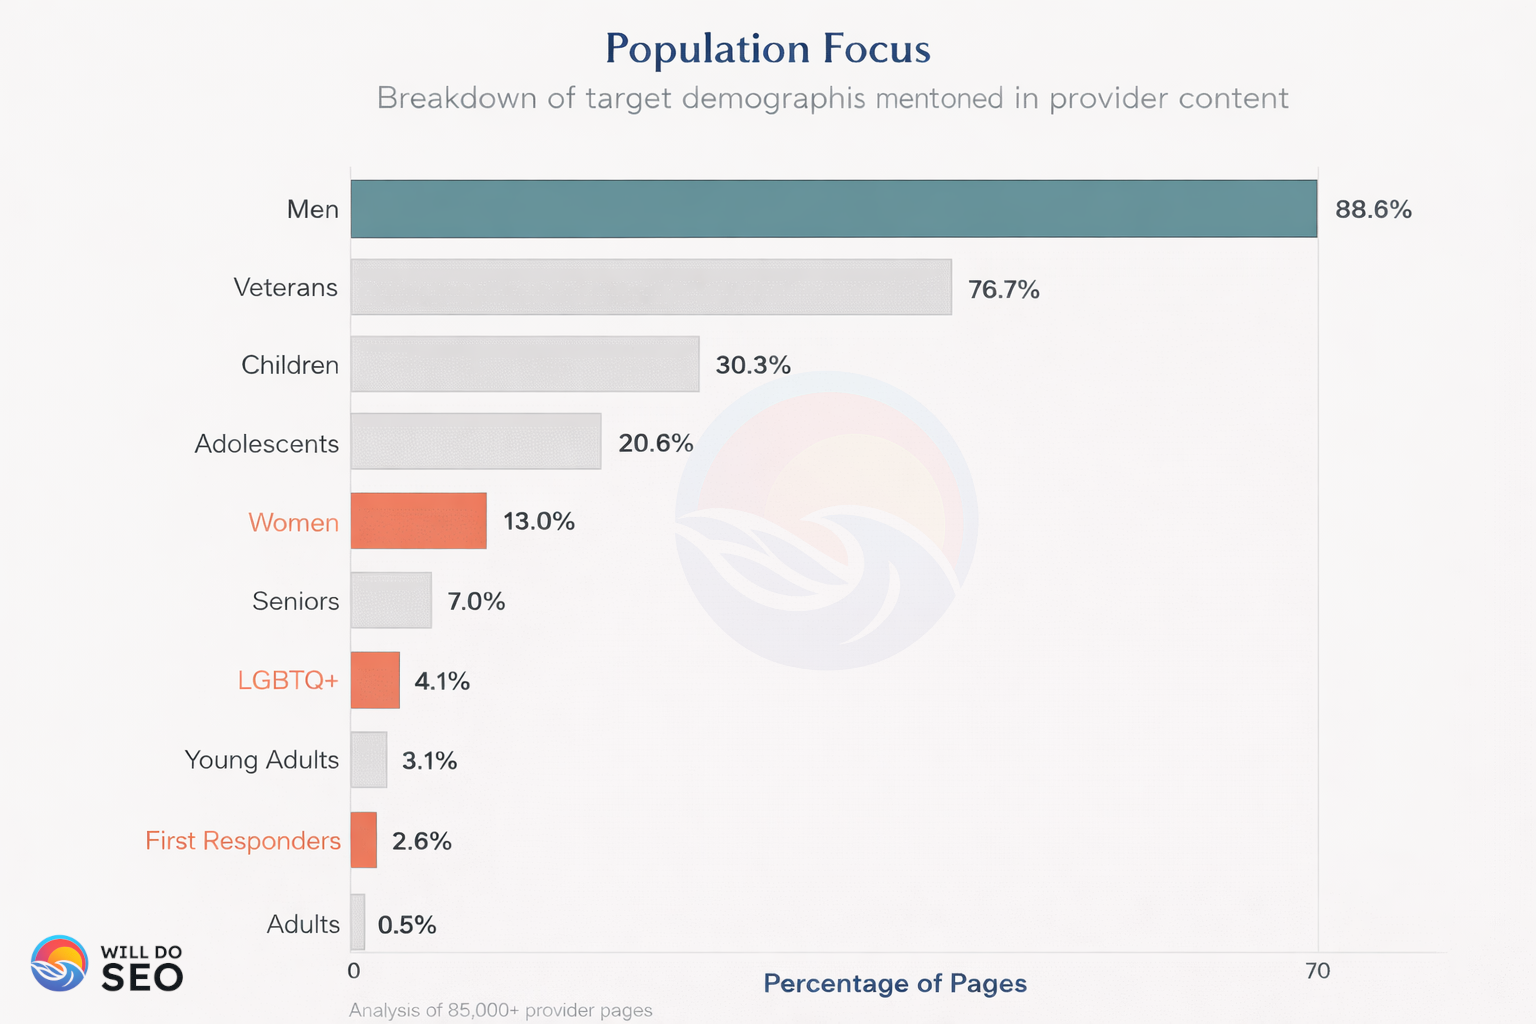
Population Focus
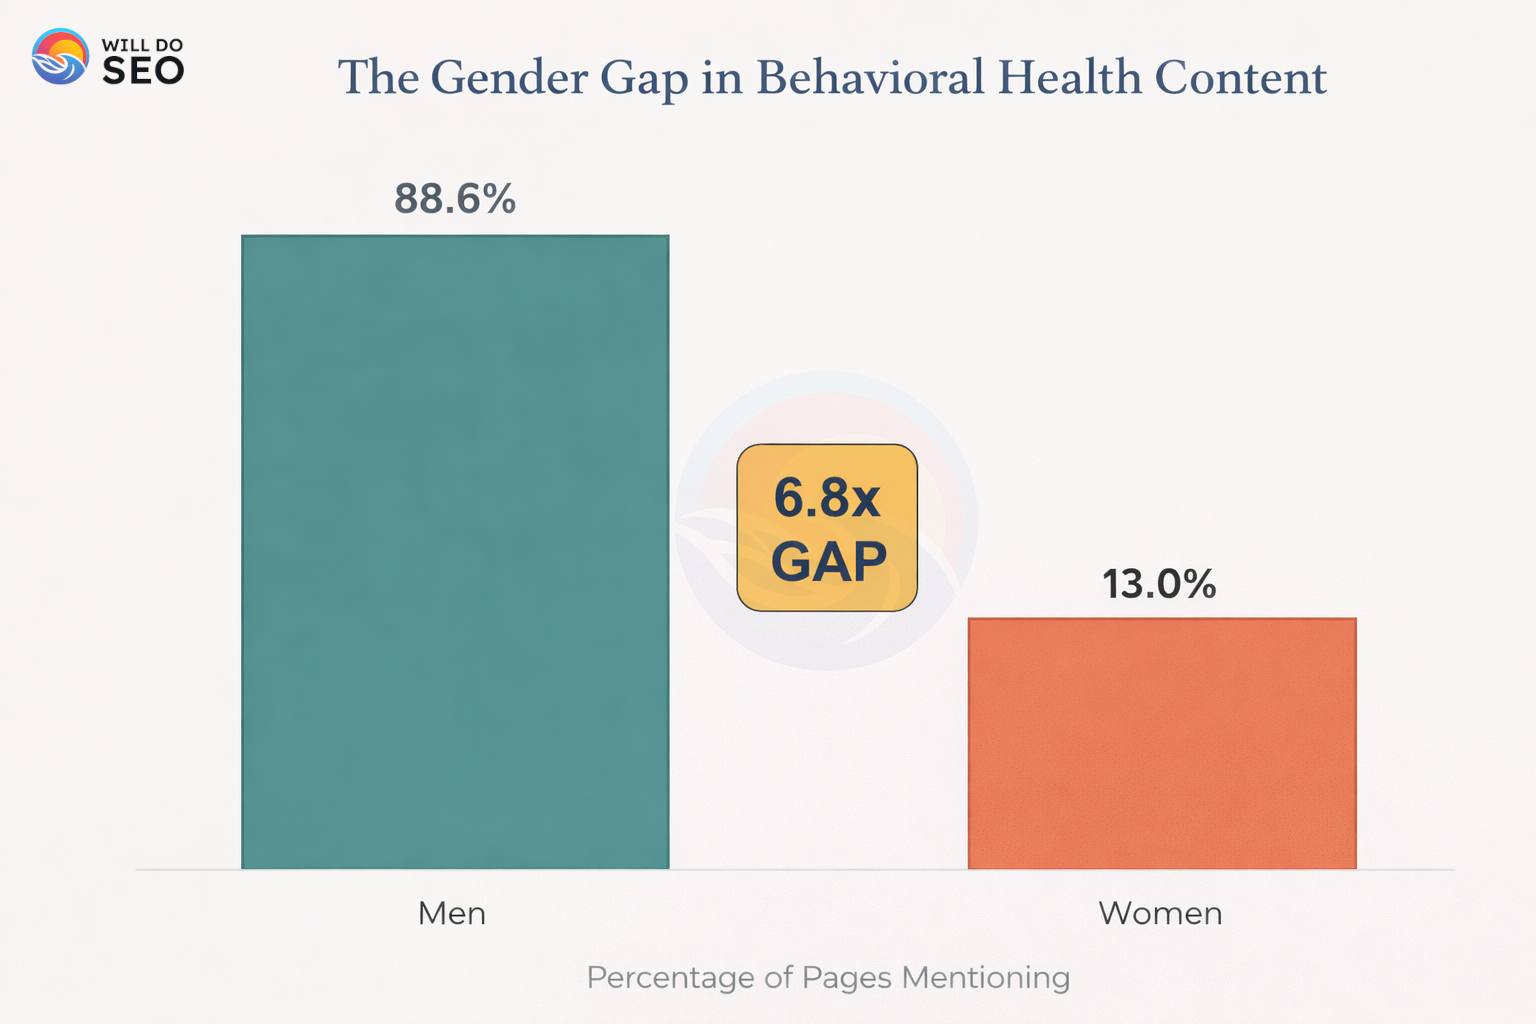
Men appear on 88.6% of pages. Women appear on 13%.
Gender
Men: 88.6% of pages | 75,455 pages
Women: 13.0% of pages | 11,093 pages
Gap: 6.8x more content for men than women
At the provider level, 97% create men-focused content while only 58% create women-focused content. That means 39% of providers create zero women-specific content.
Why Does This Matter?
Women and men have clinically different treatment needs. Research shows higher trauma correlation in women’s addiction pathways. Women respond better to trauma-informed care. Women face different barriers to care: childcare, partner control, societal judgment. And women have different patterns of co-occurring conditions, including eating disorders and sexual trauma.
Search behavior reflects these needs: “Women’s rehab” generates 8,100 monthly searches. “Women’s treatment center” generates 3,600. “Gender-specific treatment” is a growing search trend.
When women search and find content that doesn’t speak to their specific trauma patterns, parenting concerns, safety needs, and gender-specific barriers, they assume you don’t specialize in their needs, even if you do. The content gap creates a trust gap.
Full Breakdown
| Population | Coverage | Interpretation |
|---|---|---|
| Men | 88.6% | Highest coverage |
| Veterans | 76.7% | VA system, benefits, military trauma |
| Children | 30.3% | Pediatric specialization |
| Adolescents | 20.6% | Teen treatment |
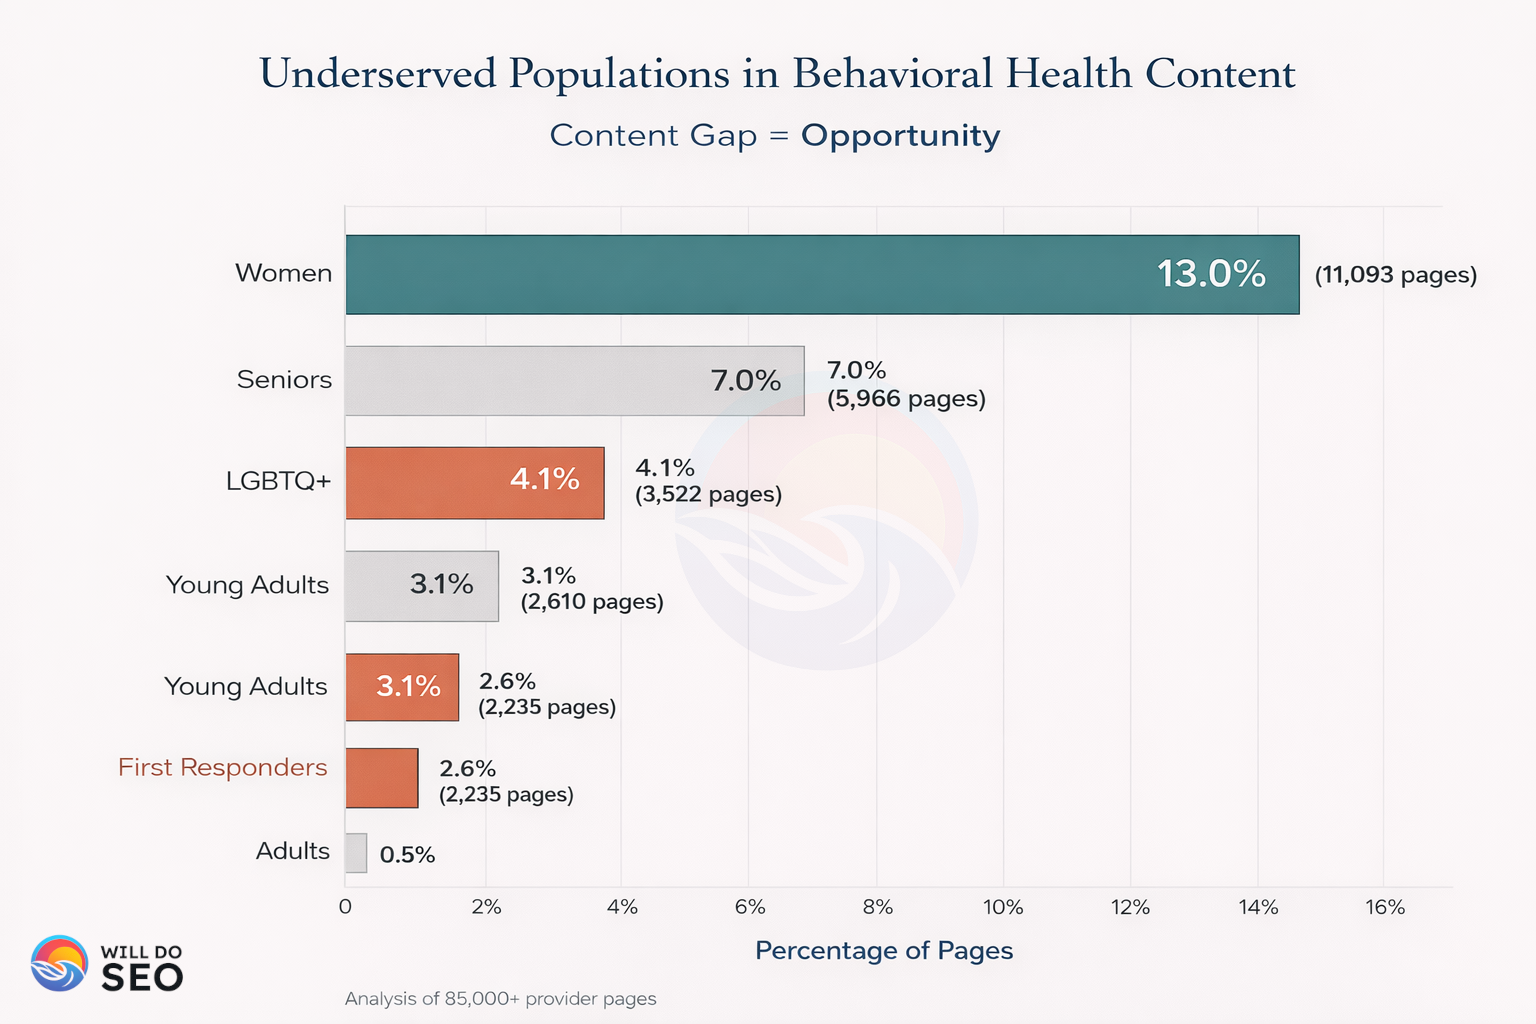
| Women | 13.0% | Underserved despite unique needs |
| Seniors | 7.0% | Growing demographic, low coverage |
| LGBTQ+ | 4.1% | Specific needs, minimal content |
| Young Adults | 3.1% | College age underserved |
| First Responders | 2.6% | Occupational trauma focus |
Veterans: 76.7%
76.7% of pages mention veterans, the second-highest population coverage after men. This reflects the VA system overlap with behavioral health, the focus on PTSD and military trauma, extensive content about VA coverage and military insurance, and “veteran-friendly” as a common differentiator.
The veteran focus is clinically appropriate. But it may overshadow other underserved populations in content strategy discussions.
LGBTQ+: 4.1%
LGBTQ+ individuals have 2.5x higher rates of substance use disorders. 48% of transgender individuals have attempted suicide. Minority stress, discrimination, and trauma create unique treatment needs.
Yet only 4.1% of pages mention LGBTQ+ populations. Only 29% of providers create LGBTQ+-specific content.
What’s missing? Content about coming out and substance use. Gender-affirming care in recovery. LGBTQ+-specific trauma. Identity-affirming treatment approaches. Chosen family in recovery.
“LGBTQ+ rehab” generates 1,300 monthly searches. “Gay-friendly treatment center” generates 720. “Transgender addiction treatment” generates 390. These are lower volumes, but high intent. These searchers are specifically looking for identity-affirming care.
Seniors: 7%
Substance use among adults 65+ increased 107% from 2000 to 2020. Prescription medication misuse is highest in seniors. Alcohol use disorders in seniors are often undiagnosed.
Yet only 7.0% of pages discuss seniors. Only 42% of providers create senior-focused content.
The gap exists due to ageism. The industry focuses on “working age” adults. Medicare complexity creates different content needs than commercial insurance. Stigma means families and medical systems are less likely to identify addiction in seniors. And search behavior differs. Families often search, not the patient themselves.
As Baby Boomers age, senior-focused behavioral health content will become increasingly valuable.
Levels of Care
Coverage is relatively balanced across most levels, except telehealth, which lags at 6.5%.
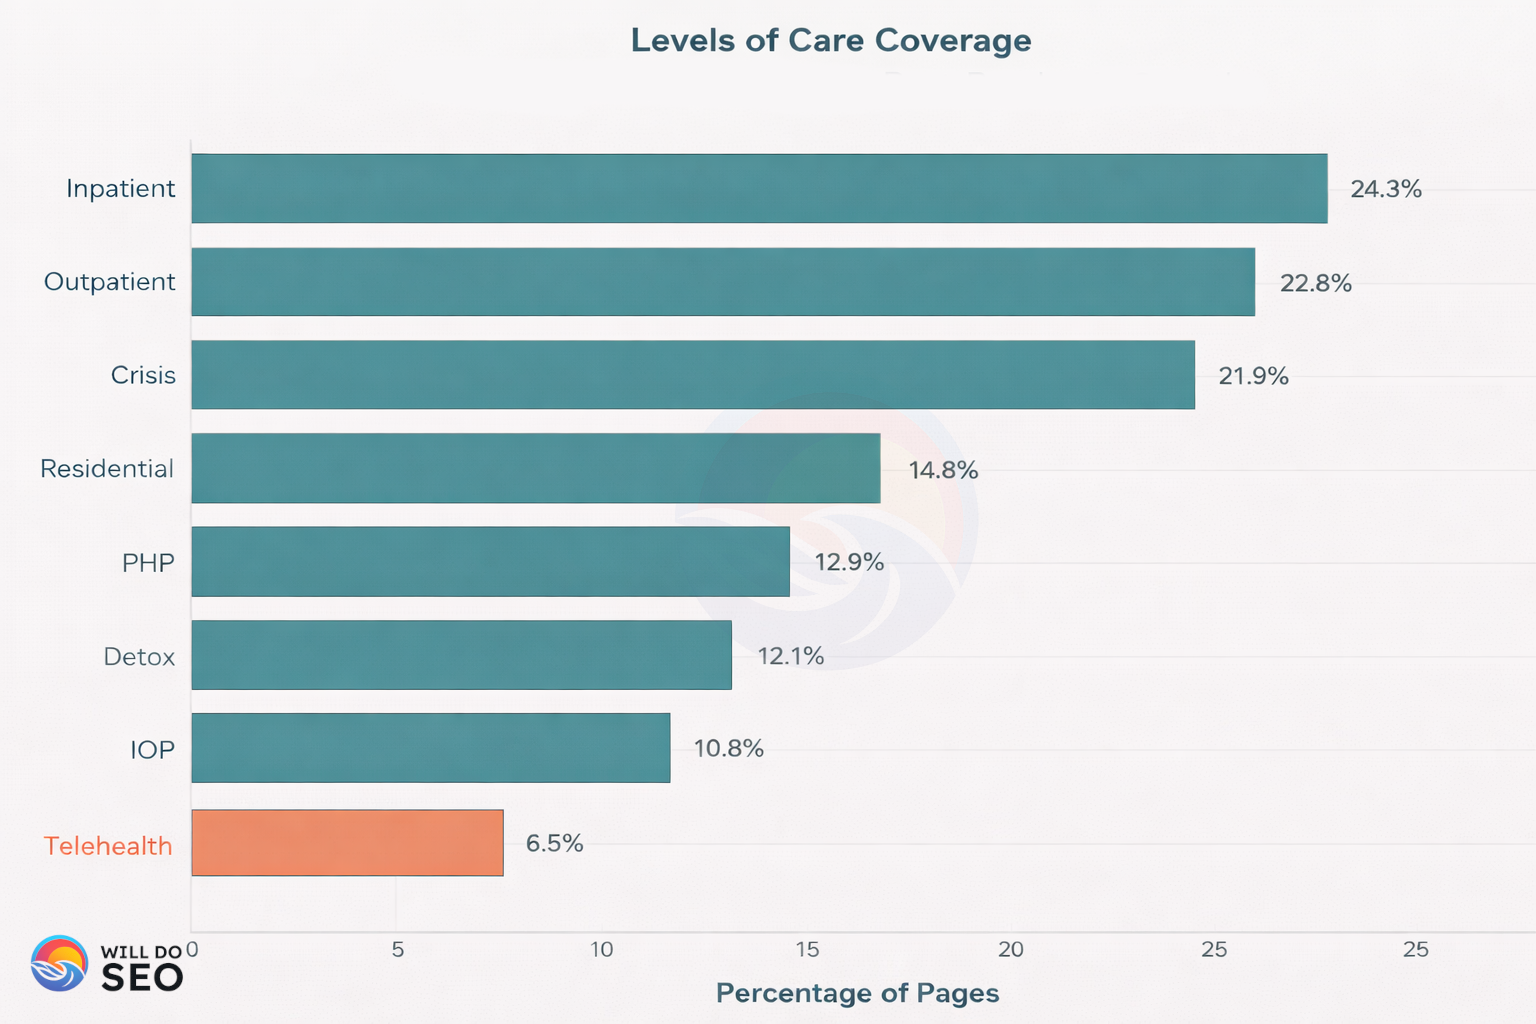
The Distribution
| Level | Coverage | Pages | Interpretation |
|---|---|---|---|
| Inpatient | 24.3% | 20,703 | Highest acuity |
| Outpatient | 22.8% | 19,432 | Least restrictive |
| Crisis | 21.9% | 18,650 | Emergency care |
| Residential | 14.8% | 12,602 | Long-term care |
| PHP | 12.9% | 11,025 | Step-down from inpatient |
| Detox | 12.1% | 10,323 | Medical withdrawal |
| IOP | 10.8% | 9,230 | Step-down from PHP |
| Telehealth | 6.5% | 5,517 | Post-pandemic gap |
| Sober Living | 3.3% | 2,845 | Recovery housing |
Telehealth: 6.5%
Telehealth use increased 38x during COVID-19. 76% of patients used telehealth by mid-2020. Many patients now prefer ongoing virtual care.
Yet only 6.5% of pages mention telehealth. Only 40% of providers create telehealth content.
What’s missing? Information about virtual IOP programs. Online therapy options. Telehealth intake processes. Technology requirements. Privacy and efficacy information.
“Online therapy” generates 201,000 monthly searches. “Virtual rehab” generates 1,900. “Telehealth addiction treatment” generates 880.
If you offer telehealth (and most providers now do), creating content about how virtual care works, what’s covered by insurance, technology requirements, and clinical effectiveness captures searches from an underserved content category with high search volume.
Crisis Services: 21.9%
21.9% of pages discuss crisis services, higher than many expected. Providers are covering crisis hotlines, emergency numbers, when to go to the ER, and crisis intervention services.
What could be expanded: family crisis guidance (“What do I do if…”), crisis de-escalation techniques, after-hours options, and the distinction between crisis and emergency situations.
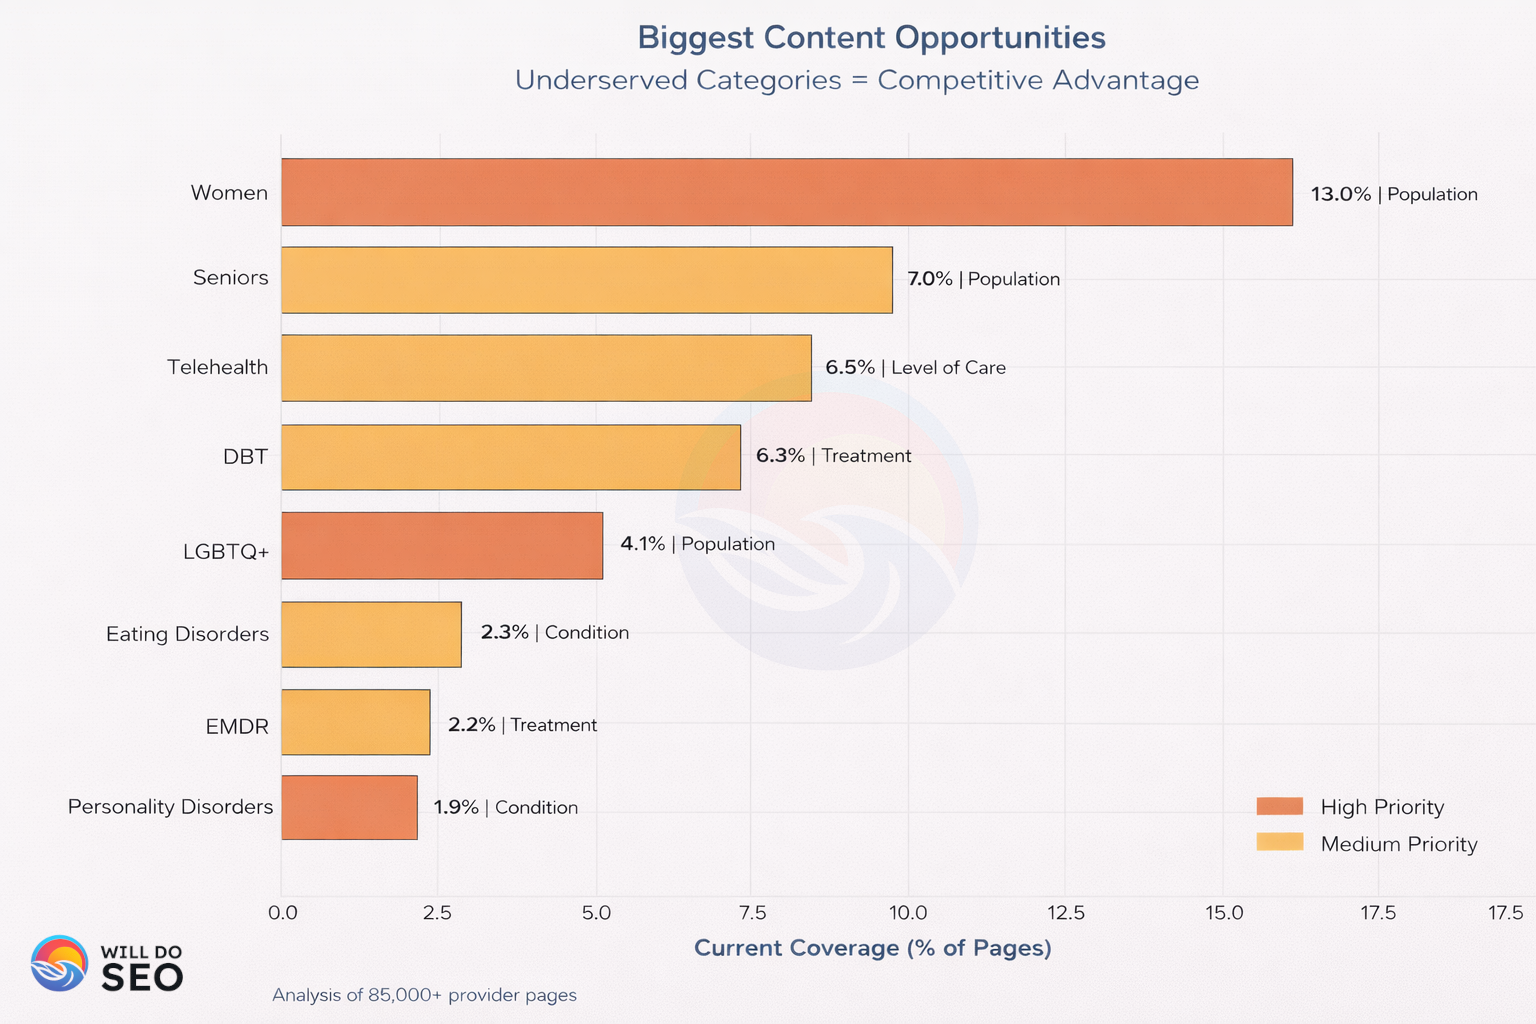
Cross-Category Combinations
The biggest opportunities are at the intersection of underserved categories.
Underserved Combinations
| Combination | Current Coverage | Opportunity |
|---|---|---|
| Women + Eating Disorders | 2.1% | Clinically aligned, virtually no content |
| LGBTQ+ + PTSD/Trauma | 1.2% | High clinical need, minimal content |
| Seniors + Depression | 1.8% | Growing demographic, underserved |
| Women + EMDR | 0.8% | Evidence-based trauma care for women |
| Adolescents + Eating Disorders | 1.6% | Peak age for ED onset |
These combinations have high clinical relevance, minimal content competition, specific patient search behavior, and differentiation potential.
Consider “Women’s eating disorder treatment”: 480 monthly searches with extremely low competition, high commercial intent, and alignment with clinical best practices for gender-specific ED treatment.
Treatment + Condition Alignments
Well-Served Combinations (high coverage): MAT + Addiction at 28.8%, CBT + Anxiety at 7.9%, ADHD + Medication Management at 34.2%.
Underserved Combinations (opportunity): EMDR + PTSD at only 1.4% despite clinical alignment. DBT + Personality Disorders at only 1.2% despite DBT being developed specifically for BPD. Family Therapy + Adolescents at only 4.3% despite clinical importance.
Creating content at the intersection of treatment and condition captures “[treatment] for [condition]” searches, demonstrates clinical expertise, and helps patients understand treatment fit.
An “EMDR for PTSD” blog post that explains how EMDR works, why it’s effective for trauma, what to expect, and how to start serves patients searching specifically for this combination while building topical authority.
Content Depth
Specialized treatments get longer, more detailed content.
Average Word Count by Treatment
Psychodynamic pages average 1,456 words. EMDR pages average 1,387 words. DBT pages average 1,342 words. MAT pages average 1,089 words. 12-Step pages average just 987 words.
Specialized treatments require more explanation. Patients need to understand what they’re getting into. Providers use depth to show expertise. And longer content tends to rank better for competitive terms.
If you specialize, longer content isn’t just good SEO. It’s meeting patient information needs.
Breadth vs. Depth
Strategy A (Breadth): Cover many topics with lighter content. Example: 50 pages at 800 words each. Captures more keywords but risks shallow content that doesn’t differentiate.
Strategy B (Depth): Cover fewer topics with comprehensive content. Example: 20 pages at 2,000 words each. Builds authority and ranking power but misses some search opportunities.
The data suggests providers in competitive markets (major cities) benefit more from depth, while providers in less competitive markets (rural areas) can succeed with broader coverage.
What To Do With This
For Content Strategists
The Framework: Coverage Gap = Opportunity
Step 1: Identify what you offer but don’t write about. Audit your services against your content. Find the gaps.
Step 2: Prioritize by competition plus volume. High search volume combined with low coverage equals top priority. Examples: telehealth, EMDR, women’s treatment.
Step 3: Create differentiation content. Focus on underserved combinations. Example: “LGBTQ+ trauma-informed care.”
Step 4: Build topical clusters. Don’t create isolated pages. Example cluster for women’s treatment: main pillar on women’s addiction treatment, supported by pages on women and trauma, women and co-occurring conditions, women and aftercare.
For Providers
Scenario 1: You specialize in an underserved area (EMDR, eating disorders, LGBTQ+ care). Action: Double down on content creation. Low competition means your content works harder. Result: Competitive advantage through discoverability.
Scenario 2: You’re in a crowded category (general addiction treatment, anxiety therapy). Action: Find underserved sub-niches. Instead of “addiction treatment,” create “addiction treatment for first responders.” Result: Differentiation within a crowded market.
Scenario 3: You serve multiple populations but your content doesn’t reflect it. Action: Create population-specific landing pages. You treat veterans, women, and young adults, but only have veteran content. Result: Capture search traffic from populations you already serve.
Beyond Business
These gaps aren’t just competitive opportunities. They’re equity concerns. Women getting 1/7th the content despite unique treatment needs. LGBTQ+ populations underserved despite higher risk. Seniors ignored despite a growing crisis. Eating disorders invisible despite the highest mortality rate.
Can providers serve underserved populations better by making services more discoverable to them?
Creating content for underserved populations improves health equity, serves mission-driven goals, and builds competitive advantage. These aren’t mutually exclusive. They’re aligned.
Content Audit Framework
Step 1: Map Your Services
List everything you actually offer: treatment modalities, conditions treated, populations served, and levels of care.
Step 2: Map Your Content
List all your existing pages. What topics are covered? How many pages per topic? What’s missing?
Step 3: Find the Gaps
Compare services to content. Services offered but not written about equals a gap. Services written about extensively may be saturated.
Step 4: Prioritize
Score opportunities by search volume (use Google Keyword Planner), competition level (reference this study’s data), your actual expertise (can you credibly create this content?), and business value (what’s the revenue per admission?).
For Underserved Topics: Content Creation Strategy
Create pillar content (2,000+ words): “The Complete Guide to [Topic]”, for example, “The Complete Guide to EMDR Therapy.”
Build supporting content: “How [Treatment] Works,” “[Treatment] vs. [Alternative Treatment],” “What to Expect from [Treatment].”
Add patient stories (if possible): “Sarah’s Story: Finding Recovery Through EMDR” humanizes and differentiates.
Create location pages: “[Treatment] in [City]” captures geo-specific searches.
Measurement
Track organic traffic to new pages, ranking position for target keywords, conversion rate from these pages, and admissions attributed to organic search.
Success indicators: new pages ranking in top 10 within 6 months, traffic increase from underserved topic keywords, and admissions from populations you were previously missing.
Conclusion
What providers write about doesn’t match what they offer or what patients need.
The gaps aren’t random. Specialized treatments like EMDR and DBT are harder to explain, so they get less content. Underserved populations like women, LGBTQ+ individuals, and seniors are harder to market to, so they get less content. Complex conditions like personality disorders and eating disorders carry more stigma, so they get less content.
But these gaps create opportunity.
You can follow the crowd and create more general addiction content (competing with 86% of providers), or fill the gaps with specialized content (competing with 15-30% of providers). The data suggests gap-filling is the better strategy.
If you serve women, create women-specific content. If you serve LGBTQ+ individuals, create LGBTQ+-affirming content. If you serve eating disorder patients, create ED-specific content. If you serve trauma survivors needing EMDR, create EMDR content. If you serve anyone via telehealth, create telehealth content.
These aren’t just SEO strategies. They’re equity strategies. They’re business strategies.
The patients searching for what you offer should be able to find you.
WillDoSEO.com
Powered By Espresso ☕️